
In today’s data-driven world, businesses rely on analytics more than ever before. While Microsoft Excel has been a trusted tool for data analysis for decades, organizations are increasingly adopting modern business intelligence tools like Tableau to gain deeper insights and make faster decisions. As a result, professionals who understand the transition from Excel to Tableau are becoming highly valuable in the job market.
If you are a fresher looking to build a career in data analytics, business intelligence, or data visualization, learning Tableau can significantly improve your career prospects. Fortunately, if you already know Excel, moving to Tableau is easier than you might think.
In this guide, we’ll explore why companies are shifting from Excel to Tableau, the key differences between the two platforms, and how freshers can successfully make the transition to modern analytics in 2026.
For many years, Excel has been the foundation of business reporting and data analysis. Professionals use it for:
Excel remains one of the most widely used software applications worldwide because it is flexible, familiar, and accessible. Most students and fresh graduates already have some exposure to Excel, making it an excellent starting point for learning analytics.
However, as businesses generate larger volumes of data, Excel faces several limitations.
Although Excel is powerful, it was not designed to handle today’s massive datasets and complex analytics requirements.
Some common challenges include:
Large datasets can slow down spreadsheets and impact performance. As data grows, managing thousands or millions of records becomes increasingly difficult.
Many Excel reports require repetitive manual updates. This process consumes valuable time and increases the risk of errors.
Excel provides charts and graphs, but creating highly interactive and dynamic dashboards is often challenging.
Sharing multiple spreadsheet versions among team members can create confusion and lead to data inconsistencies.
Because of these challenges, organizations are adopting modern analytics platforms like Tableau.
Tableau is a leading data visualization and business intelligence platform that helps users analyze data, create interactive dashboards, and uncover meaningful insights.
Unlike traditional spreadsheets, Tableau allows users to connect data from multiple sources and visualize information through interactive charts, maps, and dashboards.
Today, Tableau is used by companies across industries including healthcare, finance, retail, manufacturing, technology, and education.
As businesses continue investing in analytics, Tableau skills have become highly sought after by employers worldwide.
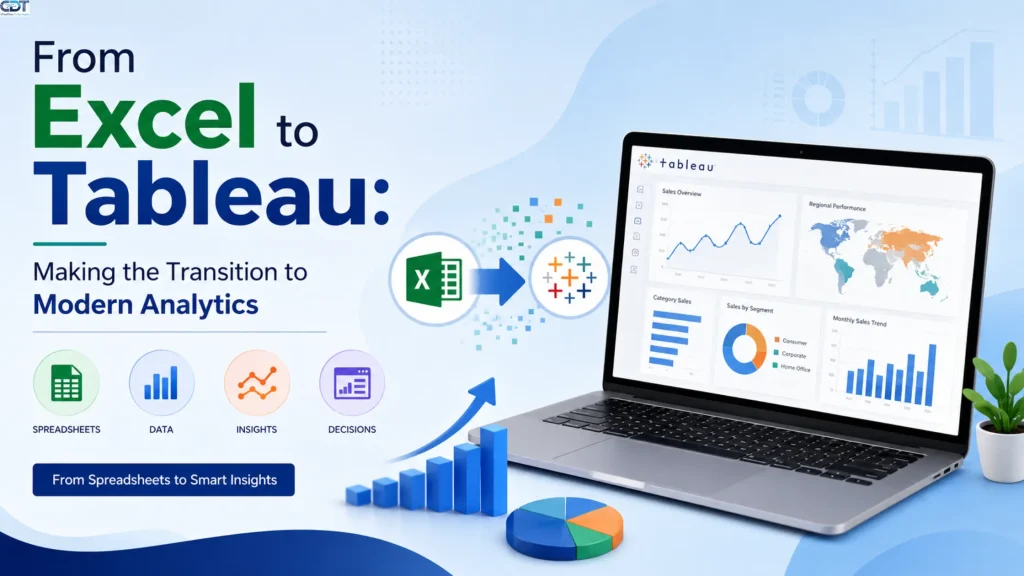
When transitioning from Excel to Tableau, it is important to understand how these tools differ.
Excel excels at:
Tableau specializes in:
Think of Excel as a tool for organizing and preparing data, while Tableau helps transform that data into actionable business insights.
Rather than replacing Excel completely, many organizations use both tools together.
The demand for analytics professionals continues to grow rapidly. Consequently, employers are actively searching for candidates who can work with modern business intelligence tools.
Here are some reasons freshers should learn Tableau:
Organizations need professionals who can convert raw data into meaningful insights. Tableau has become one of the most requested analytics skills in job descriptions.
Learning Tableau can help freshers qualify for roles such as:
If you already understand Excel formulas, tables, and data organization, learning Tableau becomes much easier.
Freshers can create impressive Tableau dashboards and showcase them in their portfolios to attract recruiters.
To successfully transition from Excel to Tableau, focus on developing these essential skills.
Learn how to present data visually through:
Effective visualization helps decision-makers understand complex information quickly.
Tableau enables users to combine multiple visualizations into interactive dashboards.
Freshers should learn:
Unlike Excel spreadsheets, Tableau can connect directly to:
Understanding data connections is a valuable skill for modern analytics professionals.
Tableau offers powerful calculated fields that allow users to perform custom calculations and derive meaningful insights.
Interactive filter and parameters help users explore data dynamically, creating more engaging dashboards.
Many freshers wonder where to begin. Fortunately, the learning process can be broken into manageable steps.
Before moving to Tableau, ensure you understand:
These skills create a solid analytics foundation.
Start with:
Practice building dashboards that solve real business problems.
Examples include:
Employers value practical experience. Therefore, create portfolio projects using public datasets.
Obtaining a Tableau certification can help validate your skills and improve your employability.
Common Mistakes Freshers Should Avoid
When learning Tableau, many beginners make avoidable mistakes.
Instead of memorizing every feature, focus on solving business problems with data.
A dashboard should be simple, clear, and easy to understand.
Avoid clutter. Use only the charts necessary to communicate insights effectively.
Strong analytics requires understanding data structure, quality, and business context.
As organizations continue embracing digital transformation, analytics is becoming a critical business function. Moreover, artificial intelligence and machine learning are increasing the importance of data visualization and business intelligence.
Tableau continues to evolve with AI-powered features, predictive analytics, and automated insights. Consequently, professionals who master Tableau will remain competitive in the analytics job market for years to come.
For freshers entering the workforce in 2026, learning Tableau is no longer just an advantage—it is becoming a necessity.
The transition from Excel to Tableau represents an important step toward modern analytics. While Excel remains a valuable tool for data management and analysis, Tableau empowers users to create interactive dashboards, uncover trends, and communicate insights more effectively.
For freshers, the journey from Excel to Tableau opens doors to exciting careers in data analytics, business intelligence, and reporting. By building strong Excel fundamentals, learning Tableau visualization techniques, and working on real-world projects, you can confidently prepare yourself for the future of analytics.
As businesses increasingly rely on data-driven decision-making, now is the perfect time to invest in Tableau skills and accelerate your professional growth in 2026 and beyond.