
Small businesses generate valuable data every day. Sales transactions, customer interactions, inventory records, marketing campaigns, and financial reports all provide insights that can help owners make smarter decisions. However, many businesses still rely on spreadsheets and manual reporting, making it difficult to identify trends or respond quickly to market changes.
Power BI, Microsoft’s leading business intelligence platform, helps small businesses transform raw data into meaningful insights through interactive dashboards and real-time reports. Whether you own a retail store, healthcare practice, manufacturing company, or service-based business, Power BI enables you to monitor key performance indicators (KPIs), improve operational efficiency, and support business growth.
In this guide, you’ll learn how Power BI Analytics empowers small businesses to make data-driven decisions and stay competitive.
Power BI is a cloud-based business intelligence and data visualization tool developed by Microsoft. It connects data from multiple sources, including Excel, SQL Server, CRM software, ERP systems, cloud applications, and online databases.
Instead of reviewing multiple spreadsheets, business owners can view all their important metrics from a single dashboard.
Power BI allows businesses to:
These capabilities help organizations make faster, more informed decisions.
Many small businesses struggle because they cannot access accurate business data quickly. Manual reporting consumes time and often leads to errors.
Power BI solves these challenges by automating data collection and presenting information in easy-to-understand visual reports.
Some of the biggest benefits include:
Businesses no longer need to guess what is happening. They can see real-time performance and take immediate action.
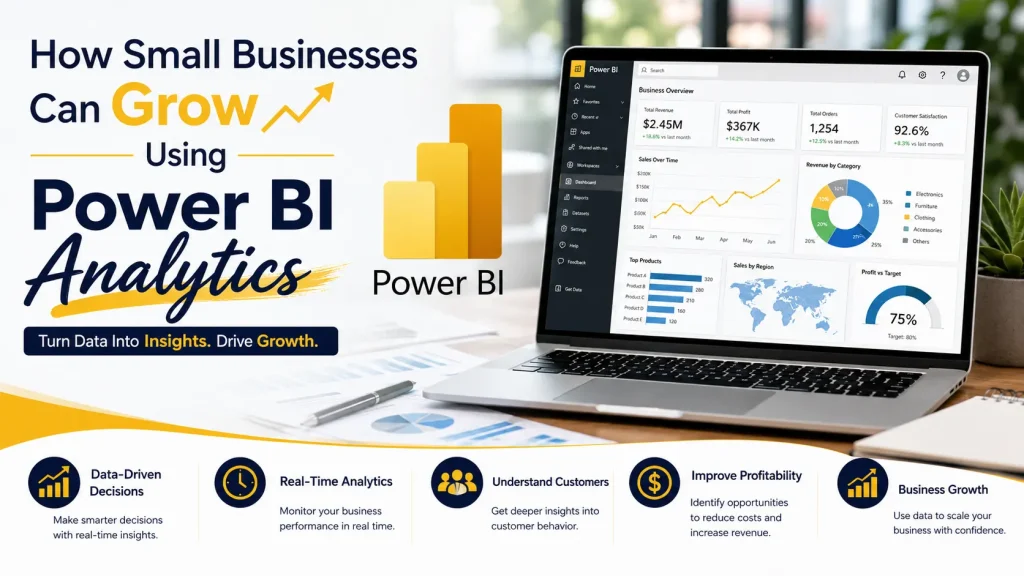
Every successful business relies on accurate information.
Power BI helps owners analyze revenue, expenses, customer behavior, employee performance, and operational efficiency from one centralized dashboard.
Instead of relying on assumptions, you can make decisions backed by real business data.
Traditional reports often become outdated before managers review them.
Power BI updates dashboards automatically as new data arrives.
Real-time monitoring allows businesses to:
This enables faster decision-making and better customer service.
Sales data contains valuable insights that many businesses overlook.
Power BI helps analyze:
These insights help businesses increase revenue by focusing on what works best.
Financial reporting becomes easier with Power BI.
Business owners can create dashboards that monitor:
Instead of waiting for monthly reports, managers can review financial performance every day.
Better visibility leads to better financial planning.
Poor inventory management often leads to lost sales and unnecessary expenses.
Power BI helps businesses monitor:
These insights help reduce inventory costs while ensuring products remain available for customers.
6.Understand Customer Behavior
Customer data plays a critical role in business growth.
Power BI combines customer information from different platforms to reveal valuable insights such as:
Businesses can use this information to personalize marketing campaigns and improve customer satisfaction.
7.Track Marketing Performance
Digital marketing generates a large amount of data.
Power BI connects with platforms such as Google Analytics, Microsoft Ads, Facebook Ads, and CRM systems to measure campaign effectiveness.
Businesses can monitor:
These reports help companies invest in campaigns that generate the highest returns.
8.Simplify Business Reporting
Manual reporting often requires hours of work every week.
Power BI automates report generation and dashboard updates.
Employees spend less time preparing reports and more time analyzing business performance.
This automation improves productivity across departments.
9.Secure Data Sharing
Power BI allows businesses to securely share reports with managers, employees, and stakeholders.
Role-based access ensures users only view information relevant to their responsibilities.
This improves collaboration while protecting sensitive business information.
Power BI supports businesses across multiple industries.
Retail
Retail businesses use Power BI to monitor sales performance, inventory, customer preferences, and seasonal trends.
Healthcare
Healthcare providers analyze patient data, appointment scheduling, billing reports, and operational performance to improve services.
Manufacturing
Manufacturers monitor production efficiency, equipment performance, inventory, and supply chain operations.
Finance
Financial teams use Power BI for budgeting, expense tracking, profitability analysis, and financial forecasting.
Education
Educational institutions analyze student performance, admissions data, attendance, and administrative reporting.
Service-Based Businesses
Consulting firms, agencies, and IT companies monitor project performance, employee productivity, and client profitability.
Traditional reporting often depends on spreadsheets that require manual updates.
Power BI offers several advantages:
These features help businesses save time while improving decision-making.
To maximize results, businesses should:
Following these practices helps organizations gain maximum value from Power BI Analytics.
Power BI has become one of the most sought-after business intelligence tools worldwide.
Professionals with Power BI skills are in high demand across industries, including healthcare, finance, retail, manufacturing, logistics, and IT services.
If you want to build a successful career in data analytics, learning Power BI can open opportunities for roles such as:
Professional training helps learners understand data modeling, DAX, Power Query, dashboard design, report publishing, and real-world business analytics.
Power BI has transformed the way small businesses analyze data and make strategic decisions.By converting complex information into interactive dashboards and real-time reports, Power BI enables business owners to improve sales. In addition, it helps monitor financial performance. Furthermore, it supports inventory optimization. Moreover, it provides deeper insights into customer behavior and, ultimately, increases overall efficiency.
As competition continues to grow, businesses that embrace data-driven decision-making gain a significant advantage. Power BI offers an affordable, scalable, and user-friendly solution for organizations looking to improve productivity and achieve sustainable growth.
If you’re ready to build expertise in Power BI and advance your career in business intelligence, Additionally, Cloud Data Technologies provides industry-focused Power BI training with hands-on projects, experienced instructors, and practical learning tailored for students, freshers, and working professionals.